Survey/Inspection Reports
Survey Form
The Survey Form report provides a PDF of the selected survey's results/comments. It provides you with the survey name, number, instructions, questions, results (including any corrective actions that were generated), and comments. This is a great way to see a completed survey and all related information.


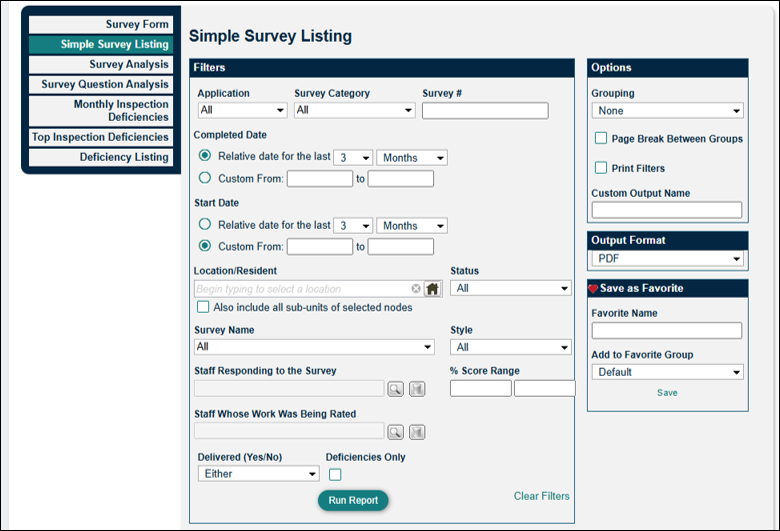
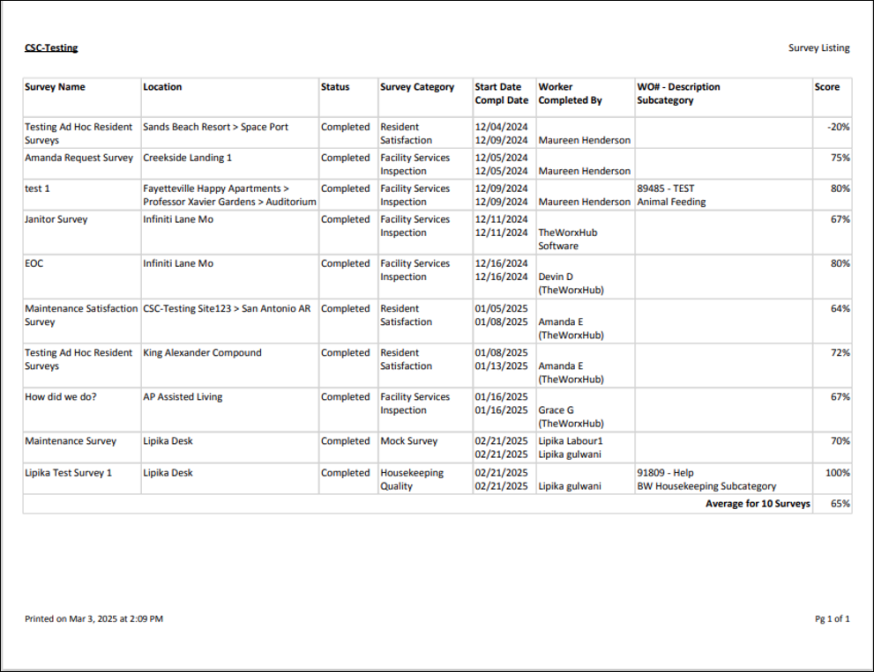
Simple Survey Listing
The Simple Survey Listing report is useful to see how your team scores on surveys in specific locations. If a team member has a consistently lower or higher score, you will be able to address those. This report is useful if you want a high level view of the surveys and inspections completed within your facility or community. If the survey generated as a result of a work order, it will include the work order description.
Survey Analysis
The Survey Analysis report provides data on the number of surveys that were completed, as well as the average score (percentage) for each survey name. You can choose to include a graph or chart in the Options section, as well as determine how you'd like to group the data. This is a great report to set up as a quarterly subscription to see the progress of your team over time. If scores are going up or down over time based on worker or location, you will have the insight on how to bring improvements to the team and their work.


Survey Question Analysis
The Survey Question Analysis report provides data on the individual survey questions that were answered, as well as the average score (percentage) for each survey question. You can choose to include a graph or chart in the Options section, as well as determine how you'd like to group the data. This report lets you examine your team's performance on individual questions, allowing you to decide if specific training is needed.


Monthly Inspection Deficiencies
The Monthly Inspection Deficiency report provides data on the total inspections completed for the selected Survey Category, as well as the total amount of deficiencies for the last 12 month period. You can determine how you want to group the data in Options. A great use of this report is to filter by a specific survey and group it by Location, showing you which locations are having repeated deficiencies over the last 12 months.


Top Inspection Deficiencies
The Top Inspection Deficiencies report provides data on the most frequent "failures" or deficiencies. It shows the total number of inspections that were completed, as well as the amount of total and "still open" deficiencies. The "Compliance %" column is a computation of the total deficiencies and the total inspections. Use this report to understand which inspection questions are most often failed, creating deficiencies, and the rate of their resolution.


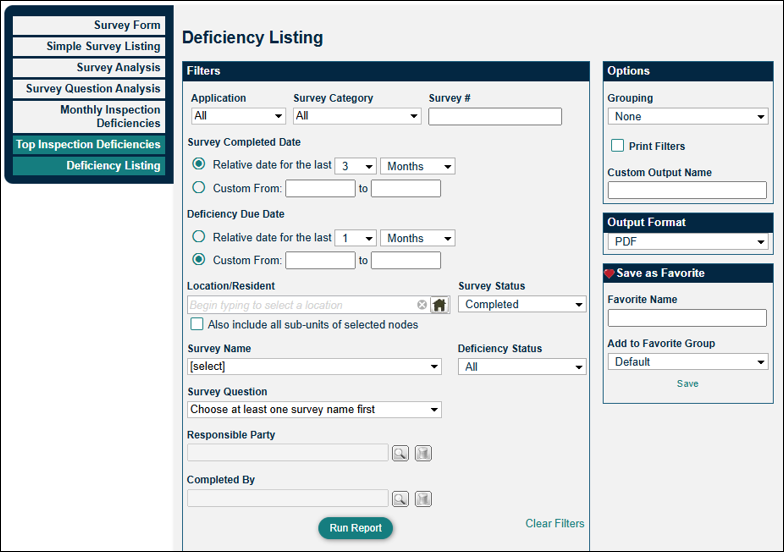
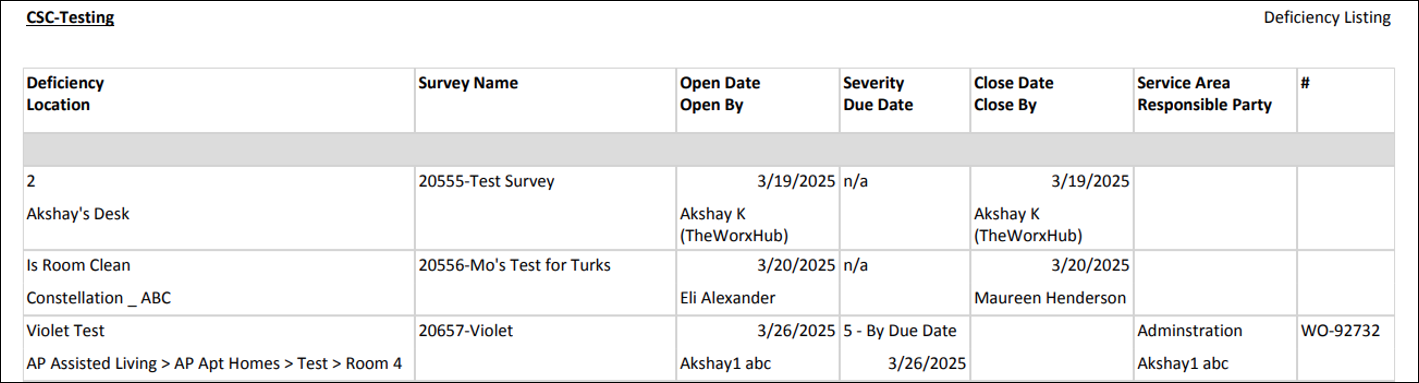
Deficiency Listing
The Deficiency Listing report displays a list of deficiencies, along with details such as: location, survey name, open and close dates, and the service area/responsible party. Use this report to get an accounting of all deficiencies that have been created, who is responsible for corrections, and whether those corrections were completed.